


Next: Network Size
Up: Experimental Evaluation
Previous: OTN and DCN Size
Figure 8:
Restoration time v/s alternate path length
(OTN size = 100 nodes, DCN size = 480 nodes; OTN edge probability = 0.13 and that of DCN = 0.19).
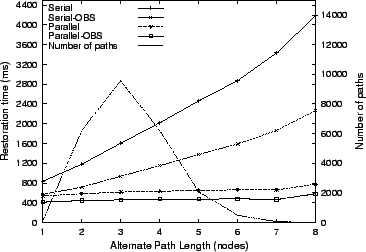 |
In Experiment 2, the OTN and DCN sizes were held constant. The restoration
time for all alternate path-lengths was measured over a set of ten
random DCN/OTN pairs. The pure-random model was used for generating
edges with edge probabilities 0.13 and 0.19 and sizes fixed at 100 and
480 nodes for the OTN and the DCN respectively. Figure 8
shows the performance of each of the
four schemes on varying path lengths, and the distribution of path lengths
(scaled down ten-fold) in the OTN graphs on which the measurements
were performed. As seen from the results, Parallel OBS activation scheme scales
better than all the other schemes as path length increases. Similarly,
parallel activation also scales well with path length but performs worse
than its OBS cousin. Parallel schemes thus benefit from the structure
of the DCN whereas serial schemes do not.
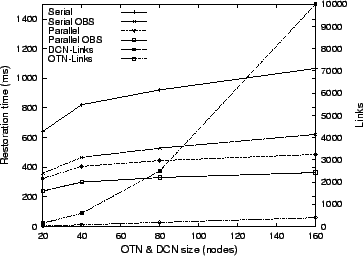
Figure 9:
Restoration time v/s network size (edge probability of OTN = 0.4 and
that of DCN = 0.18).
 |
Next: Network Size
Up: Experimental Evaluation
Previous: OTN and DCN Size
Swapnil Bhatia
2002-08-02