Uncertainty Visualization in Isosurface Volume Rendering: A Case Study
Philip J. Rhodes
Robert S. Laramee
R. Daniel Bergeron
Ted M. Sparr
Department of Computer Science
University of New Hampshire
Durham, NH 03824 USA
{rhodes,rlaramee,rdb,tms}@cs.unh.edu
Overview
We describe a technique for rendering isosurfaces in multiresolution volume data so that uncertainty (error) is shown in the visualization.
Uncertainty visualization is typically difficult, but the nature of isosurface rendering makes it amenable to an effective solution.
Visualizing Uncertainty
Not much research has been done with visualizing uncertainty outside of GIS.
Visualization of locally defined uncertainty adds yet another variate to be processed.
• This is a burden with large scientific datasets, simply because of the increase in size.
• The visualization channel has limited bandwidth. Visualization of uncertainty must compete with visualization of data.
• uncertainty information may not be easily available, except in some very abstract form.
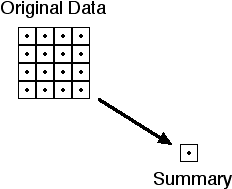
Multiresolution Data
MR Data consists of a hierarchy of increasingly coarse approximations.
• Each level of the hierarchy introduces additional error.
• This error may be reasonably easy to measure
• At coarser levels, this additional error becomes greater than the error present in the original data.
• Scientists would like to know the uncertainty present in a particular representation of the data.
Adaptive Resolution
• Resolution varies over the data domain in response to data values.
• Scientists want to know how faithfully a region of the data is represented.
• He or she may wish to increase the resolution in interesting regions that are represented with unacceptably high uncertainty.
Isosurface Rendering
Isosurface rendering is an excellent candidate for uncertainty visualization.
• Since the entire isosurface has the same data value, the value itself does not need to be visualized.
• Conventional rendering techniques produce a surface with constant color value.
• Therefore, the color parameter is available to visualize uncertainty.
Error Generation
float computeError(float summary,
float cube[],int size){
float error=0;
int c;
for(c=0;c<size;c++){
error+=fabs(summary-cube[c]);
}
return error/size;
}
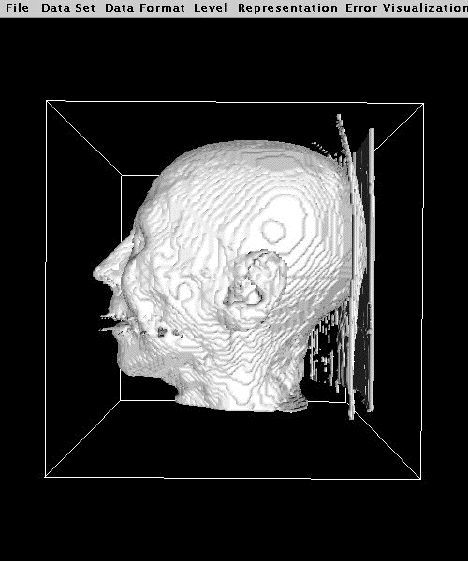
Figure 1. 1283 data; skin isovalue (0.185);uncertainty disabled
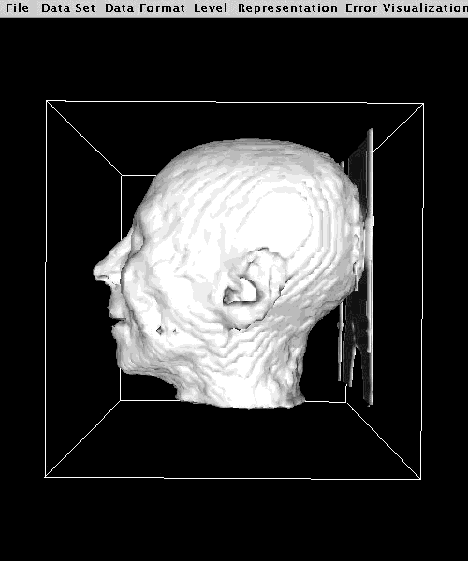
Figure 2. 643 data; skin isovalue (0.185); uncertainty disabled
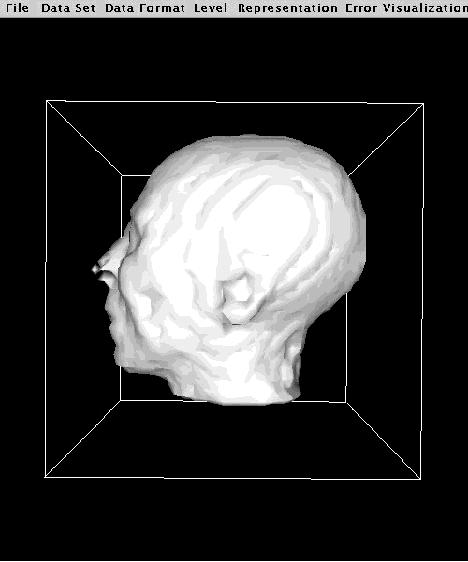
Figure 3. 323 data; skin isovalue (0.185); uncertainty disabled
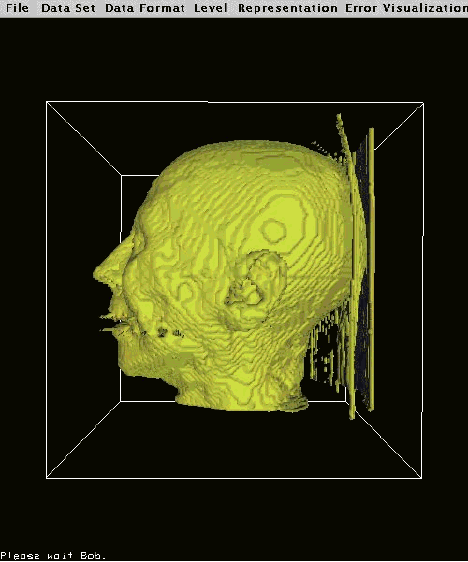
Figure 4. 1283 data; skin isovalue (0.185); uncertainty mapped to hue with range (144,0)
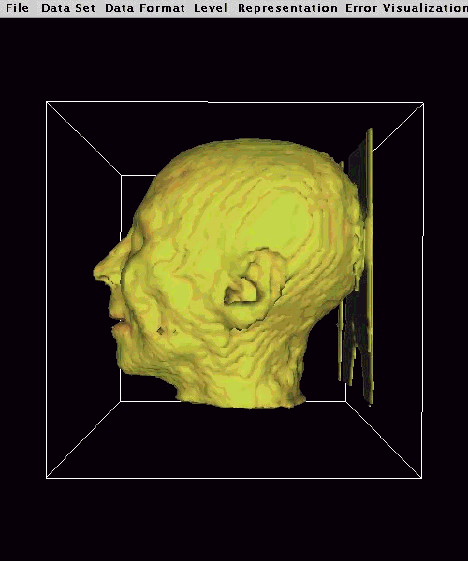
Figure 5. 643 data; skin isovalue (0.185); uncertainty mapped to hue with range (144,0)
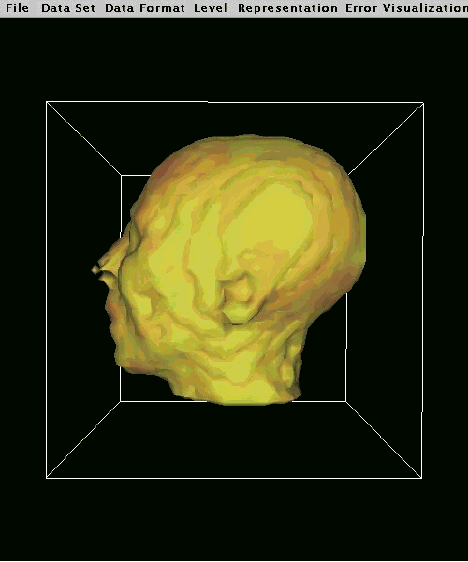
Figure 6. 323 data; skin isovalue (0.185); uncertainty mapped to hue with range (144,0)
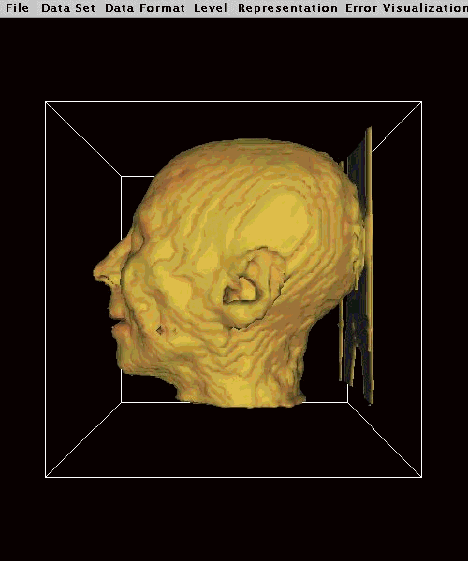
Figure 7. 643 data; skin isovalue (0.185); uncertainty mapped to hue with range (108,0)
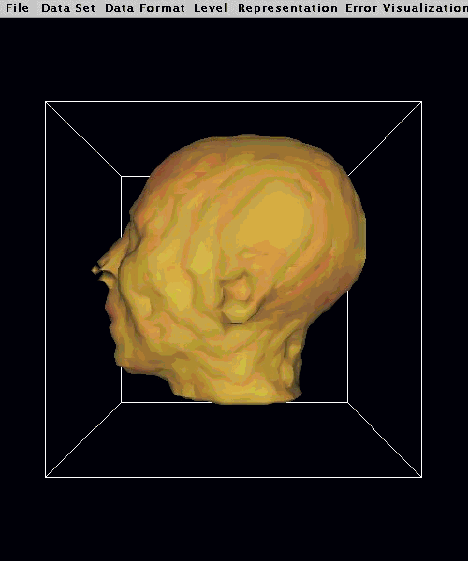
Figure 8. 323 data; skin isovalue (0.185); uncertainty mapped to hue with range (108,0)
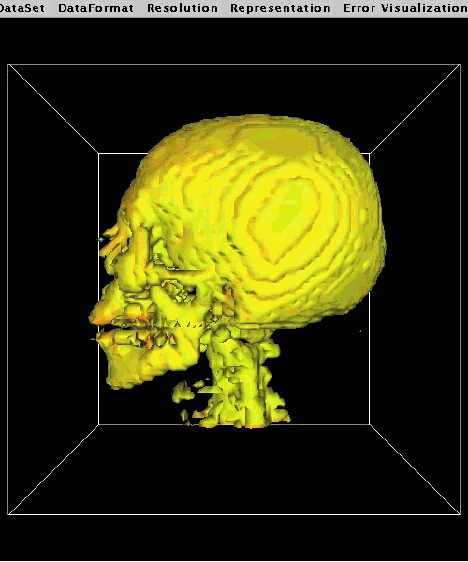
Figure 9. 5% AR Data; bone isovalue (0.378); uncertainty mapped to hue with range (144,0)