Experiments of the packet dropper module( by Glen ) Modified by Lin
Modified: Packets are not dropped randomly (it's inefficient). One out of every 1/Rate packets are dropped.
Test Script file for the test
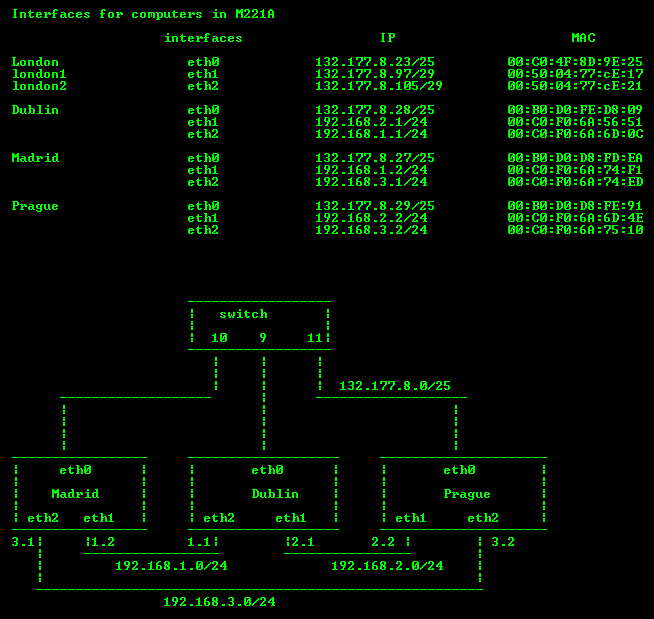
Network infrastructure diagram,
Packet Flow: Madrid:eth1==>Dublin:eth2==>Dublin:eth1==>Prague:eth2
Packet dropper is running on the Static Router (Dublin).
Packet Dropper Module code Makefile
TCP connection. Request Size is optimal size 1448Bytes.
Kernel file modified: /usr/src/linux/net/core/dev.c /usr/src/linux/net/netsyms.c
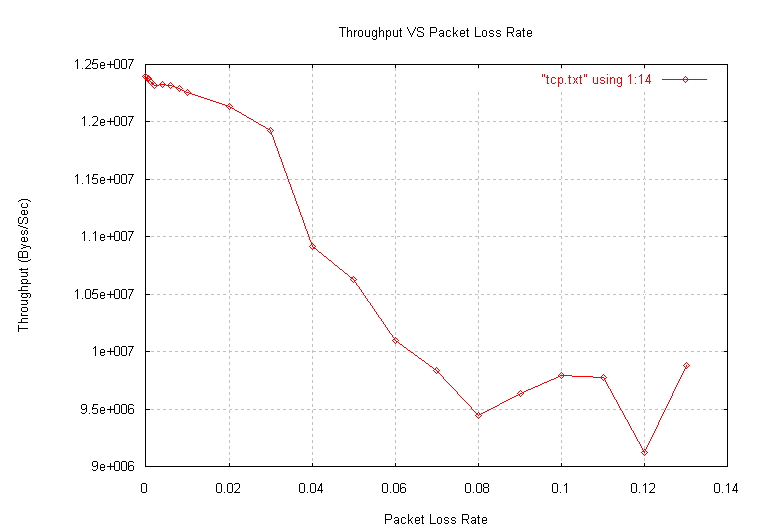
| Experiment on packet_dropper. packets are dropped one out of every 1/rate packets | |||||||||||||
| drop rate | Elapse time ( sec ) Tcp request size 1448 bytes, iteration time 100000 | Throughput(B/s) | |||||||||||
| 1st | 2nd | 3rd | 4th | 5th | 6th | 7th | 8th | 9th | 10th | AVG | Var | ||
| 0 | 12.33 | 12.31 | 12.31 | 12.31 | 12.31 | 12.31 | 12.31 | 12.31 | 12.31 | 12.31 | 12.312 | 0.004 | 12394411.96 |
| 0.0001 | 12.33 | 12.32 | 12.32 | 12.32 | 12.32 | 12.32 | 12.32 | 12.32 | 12.32 | 12.32 | 12.321 | 0.002 | 12385358.33 |
| 0.0005 | 12.34 | 12.33 | 12.33 | 12.33 | 12.33 | 12.33 | 12.33 | 12.33 | 12.33 | 12.33 | 12.331 | 0.002 | 12375314.25 |
| 0.001 | 12.36 | 12.35 | 12.35 | 12.35 | 12.35 | 12.35 | 12.35 | 12.39 | 12.36 | 12.35 | 12.356 | 0.008 | 12350275.17 |
| 0.002 | 12.40 | 12.39 | 12.39 | 12.39 | 12.39 | 12.39 | 12.39 | 12.39 | 12.39 | 12.39 | 12.391 | 0.002 | 12315390.20 |
| 0.004 | 12.39 | 12.38 | 12.38 | 12.38 | 12.38 | 12.38 | 12.38 | 12.38 | 12.38 | 12.38 | 12.381 | 0.002 | 12325337.21 |
| 0.006 | 12.40 | 12.39 | 12.39 | 12.39 | 12.39 | 12.39 | 12.39 | 12.39 | 12.39 | 12.39 | 12.391 | 0.002 | 12315390.20 |
| 0.008 | 12.43 | 12.42 | 12.42 | 12.42 | 12.42 | 12.42 | 12.42 | 12.42 | 12.42 | 12.42 | 12.421 | 0.002 | 12285645.28 |
| 0.01 | 12.45 | 12.45 | 12.44 | 12.44 | 12.44 | 12.50 | 12.45 | 12.45 | 12.45 | 12.45 | 12.452 | 0.010 | 12255059.43 |
| 0.02 | 12.59 | 12.58 | 12.58 | 12.58 | 12.58 | 12.58 | 12.58 | 12.58 | 12.58 | 12.58 | 12.581 | 0.002 | 12129401.48 |
| 0.03 | 12.92 | 12.73 | 12.71 | 12.78 | 12.71 | 12.84 | 13.04 | 12.78 | 12.72 | 12.74 | 12.797 | 0.082 | 11924669.84 |
| 0.04 | 14.02 | 13.96 | 13.95 | 13.94 | 13.96 | 13.95 | 14.14 | 13.96 | 13.93 | 13.96 | 13.977 | 0.041 | 10917936.61 |
| 0.05 | 14.36 | 14.34 | 14.33 | 14.32 | 14.53 | 14.32 | 14.33 | 14.33 | 14.35 | 14.33 | 14.354 | 0.036 | 10631182.95 |
| 0.06 | 15.12 | 15.16 | 15.11 | 15.10 | 15.12 | 15.12 | 15.11 | 15.10 | 15.10 | 15.11 | 15.115 | 0.012 | 10095931.19 |
| 0.07 | 15.56 | 15.67 | 15.54 | 15.47 | 15.53 | 15.47 | 15.47 | 15.48 | 15.52 | 15.44 | 15.515 | 0.049 | 9835642.93 |
| 0.08 | 16.30 | 16.06 | 16.06 | 16.26 | 16.07 | 16.06 | 16.28 | 16.07 | 16.06 | 16.27 | 16.149 | 0.103 | 9449501.52 |
| 0.09 | 15.92 | 15.75 | 15.93 | 15.73 | 15.93 | 15.75 | 15.94 | 15.74 | 15.95 | 15.72 | 15.836 | 0.098 | 9636271.79 |
| 0.10 | 15.79 | 15.42 | 15.58 | 15.81 | 15.43 | 15.61 | 15.42 | 15.77 | 15.61 | 15.41 | 15.585 | 0.133 | 9791466.15 |
| 0.11 | 15.79 | 15.41 | 15.78 | 15.62 | 15.42 | 15.79 | 15.43 | 15.59 | 15.80 | 15.41 | 15.604 | 0.152 | 9779543.71 |
| 0.12 | 16.66 | 17.06 | 17.63 | 17.83 | 15.88 | 16.08 | 16.46 | 16.43 | 17.25 | 15.89 | 16.717 | 0.580 | 9128432.13 |
| 0.13 | 15.51 | 15.30 | 15.70 | 15.30 | 15.49 | 15.30 | 15.49 | 15.49 | 15.50 | 15.30 | 15.438 | 0.110 | 9884700.09 |
For Postscript version of this chart. here Gnuplot file here. Datafile here
Detailed Experiment Data are: drop0 drop0.0001 drop0.0005 drop0.001 drop0.002 drop0.004 drop0.006 drop0.008 drop0.01 drop0.02 drop0.03 drop0.04 drop0.05 drop0.06 drop0.07 drop0.08 drop0.09 drop0.10 drop0.11 drop0.12 drop0.13 drop0.15
UDP experiment result shows that the packet loss is approximate the percentage we specified in the packet_dropper module
See the UDP experiment detail data: drop0 drop0.0001 drop0.0005 drop0.001 drop0.002 drop0.004 drop0.006 drop0.008 drop0.01 drop0.02 drop0.03 drop0.04 drop0.05
Interesting Result: When the packet loss rate is set to 0.15 ( ie, drop one out of every 6 packets ). The elapse time varies as the iteration times increases.
| Iteration Times | Time elapse (Second) | Throughput (Bytes/Sec) | |||||||||||
| 1st | 2nd | 3rd | 4th | 5th | 6th | 7th | 8th | 9th | 10th | AVG | Var | ||
| 1000 | 0.35 | 0.35 | 0.35 | 0.35 | 0.35 | 0.35 | 0.35 | 0.35 | 0.35 | 0.36 | 0.351 | 0.002 | 4347578 |
| 10000 | 1.76 | 1.76 | 1.76 | 1.76 | 1.76 | 1.76 | 1.76 | 1.76 | 1.76 | 1.76 | 1.76 | 0 | 8670455 |
| 20000 | 3.34 | 3.32 | 3.33 | 3.32 | 3.32 | 3.32 | 3.32 | 3.32 | 3.32 | 127.89 | 15.780 | 22.422 | 1934094 |
| 30000 | 4.90 | 4.88 | 4.88 | 543.45 | 4.88 | 4.88 | 4.88 | 4.88 | 1319.27 | 4.88 | 190.178 | 296.473 | 240722 |
| 40000 | 1079.77 | 1794.92 | 6.44 | 6.44 | 6.44 | 6.44 | 6.44 | 6.44 | 6.45 | 6.44 | 292.622 | 457.889 | 208597 |
| 50000 | 8.03 | 8.01 | 8.01 | 8.01 | 8.00 | 8.00 | 2650.93 | 8.01 | 8.00 | 8.00 | 272.300 | 475.726 | 280206 |
| 60000 | 1516.12 | 9.56 | 9.56 | 9.57 | 9.56 | 9.56 | 1961.96 | 318.02 | 9.56 | 1272.67 | 512.614 | 642.582 | 178614 |
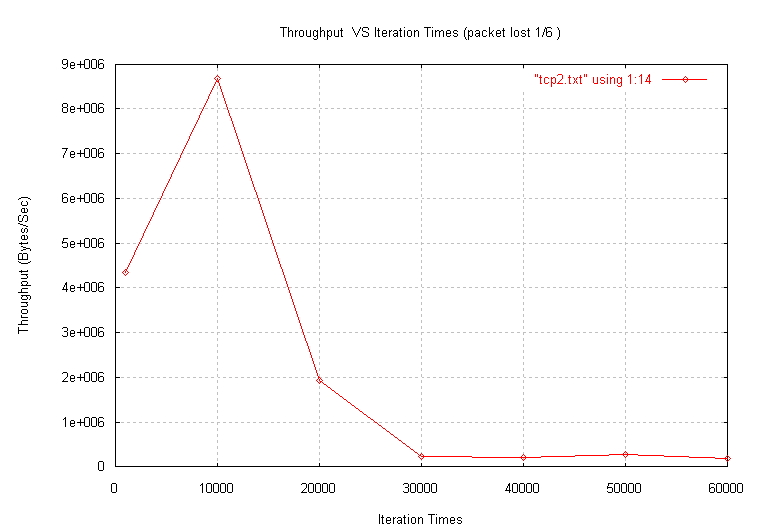
For Postscript version of this chart. here Gnuplot file here. Datafile here
Detailed Experiment Data are: test1000, test10000, test20000, test30000, test40000, test50000, test60000