Experiments on Nov23.
Test Script file for the test
Network infrastructure diagram,
Packet Flow: Madrid:eth1==>Dublin:eth2==>Dublin:eth1==>Prague:eth2
Packet dropper is running on the Static Router (Dublin).
Packet Dropper Module code Makefile
Module to change the dropping rate and destination address via manipulating the /proc file system: change_kernel code, user-space code Makefile
To use module "change", use "make install" after
installing "packet_dropper" module,
then use user space program
"input rate ip_address" it will
change the rate and destination address in
packet_dropper module dynamically.
To check the rate and destination ip address, use "cat /proc/linTry/foo", you will get information like:
Dropping Rate shows only the first 6 digits after '.'
Dropping Rate is: 0.000499
Destination IP is: 192.168.2.2
TCP connection. Request Size is optimal size 1448Bytes.
Kernel file modified: /usr/src/linux/net/core/dev.c /usr/src/linux/net/netsyms.c
The packet_dropper code has been changed to drop packets randomly. The random number is selected according to the CPU clock. Some bit operations are done after selecting the CPU cycle.
NOTE: It's almost impossible to find an algorithm that drops the packet RANDOMLY at the EXACT rate we specified. The actual rate of packets being dropped may be a little bit different from the rate we specify in the packet_dropper.
See the UDP packet loss experiments
drop0 drop0.0001 drop0.0005 drop0.001 drop0.002 drop0.004 drop0.006 drop0.008 drop0.01 drop0.02 drop0.03 drop0.04 drop0.05 drop0.06 drop0.07 drop0.08 drop0.09 drop0.1 drop0.11 drop0.12 drop0.13 drop0.14
(The above files are stored in 132.177.67.158 because I ran out disk space on pubpages.unh.edu)
| Time Elapse( sec ) (Randomly dropping packets) | |||||||||||||
| DropRate | 1st | 2nd | 3rd | 4th | 5th | 6th | 7th | 8th | 9th | 10th | AVG | Var | Throughput (Bytes/Sec) |
| 0.0000 | 12.32 | 12.31 | 12.31 | 12.31 | 12.31 | 12.31 | 12.31 | 12.31 | 12.31 | 12.31 | 12.31 | 0.00 | 12395418.73 |
| 0.0001 | 12.33 | 12.32 | 12.32 | 12.32 | 12.32 | 12.32 | 12.32 | 12.32 | 12.32 | 12.31 | 12.32 | 0.00 | 12386363.64 |
| 0.0005 | 12.34 | 12.33 | 12.32 | 12.33 | 12.33 | 12.33 | 12.33 | 12.33 | 12.33 | 12.33 | 12.33 | 0.00 | 12376317.92 |
| 0.0010 | 12.36 | 12.35 | 12.35 | 12.35 | 12.34 | 12.35 | 12.35 | 12.34 | 12.35 | 12.34 | 12.35 | 0.00 | 12358276.64 |
| 0.0020 | 12.38 | 12.37 | 12.76 | 12.38 | 12.37 | 12.57 | 12.56 | 12.56 | 12.37 | 12.37 | 12.47 | 0.11 | 12238351.11 |
| 0.0040 | 13.19 | 12.98 | 12.60 | 12.60 | 12.80 | 12.79 | 12.60 | 13.17 | 13.18 | 12.79 | 12.87 | 0.21 | 11857031.86 |
| 0.0060 | 12.82 | 12.42 | 13.00 | 13.38 | 12.81 | 12.81 | 13.39 | 13.20 | 13.38 | 13.00 | 13.02 | 0.25 | 11719529.99 |
| 0.0080 | 14.21 | 13.22 | 14.18 | 13.03 | 14.29 | 13.22 | 13.60 | 13.41 | 13.79 | 13.42 | 13.64 | 0.38 | 11190144.46 |
| 0.0100 | 14.40 | 14.60 | 14.79 | 15.39 | 13.64 | 13.62 | 14.44 | 15.58 | 14.89 | 14.77 | 14.61 | 0.47 | 10443471.12 |
| 0.0200 | 23.18 | 23.26 | 20.27 | 21.83 | 18.21 | 19.73 | 22.54 | 18.77 | 19.50 | 18.99 | 20.63 | 1.66 | 7397711.85 |
| 0.0300 | 30.14 | 29.67 | 30.83 | 29.00 | 30.16 | 32.27 | 38.19 | 31.65 | 27.80 | 28.94 | 30.87 | 1.90 | 4944111.45 |
| 0.0400 | 45.17 | 39.52 | 50.48 | 42.35 | 42.62 | 47.54 | 46.42 | 44.65 | 45.90 | 50.44 | 45.51 | 2.65 | 3353182.89 |
| 0.0500 | 68.78 | 65.78 | 70.92 | 62.93 | 59.25 | 65.20 | 68.24 | 72.56 | 72.21 | 57.98 | 66.39 | 4.16 | 2298712.06 |
| 0.0600 | 81.74 | 96.67 | 107.26 | 83.44 | 95.42 | 92.58 | 93.66 | 95.56 | 96.27 | 88.57 | 93.12 | 5.23 | 1638798.50 |
| 0.0700 | 115.56 | 119.23 | 117.34 | 122.33 | 117.69 | 125.01 | 136.47 | 134.89 | 110.31 | 125.99 | 122.48 | 6.49 | 1245897.36 |
| 0.0800 | 152.77 | 159.41 | 152.10 | 151.19 | 150.76 | 172.83 | 161.07 | 153.58 | 156.04 | 154.08 | 156.38 | 4.83 | 975809.39 |
| 0.0900 | 189.42 | 213.50 | 191.52 | 211.65 | 178.59 | 192.32 | 182.10 | 183.13 | 213.83 | 183.22 | 193.93 | 11.44 | 786889.98 |
| 0.1000 | 238.04 | 246.07 | 271.07 | 274.35 | 234.52 | 227.36 | 252.14 | 233.99 | 245.32 | 231.08 | 245.39 | 12.41 | 621857.10 |
| 0.1100 | 285.11 | 299.36 | 344.97 | 274.29 | 292.41 | 295.05 | 308.04 | 306.71 | 288.01 | 303.28 | 299.72 | 12.82 | 509136.77 |
| 0.1200 | 361.30 | 340.43 | 368.80 | 366.94 | 330.97 | 322.50 | 326.55 | 336.29 | 353.63 | 345.89 | 345.33 | 13.98 | 441896.16 |
| 0.1300 | 417.23 | 437.84 | 369.94 | 417.01 | 371.42 | 395.34 | 409.48 | 420.01 | 384.71 | 386.91 | 400.99 | 19.33 | 380559.07 |
| 0.1400 | 435.03 | 476.66 | 477.05 | 500.55 | 502.79 | 480.83 | 481.06 | 482.92 | 473.48 | 469.59 | 478 | 11.63 | 319249.53 |
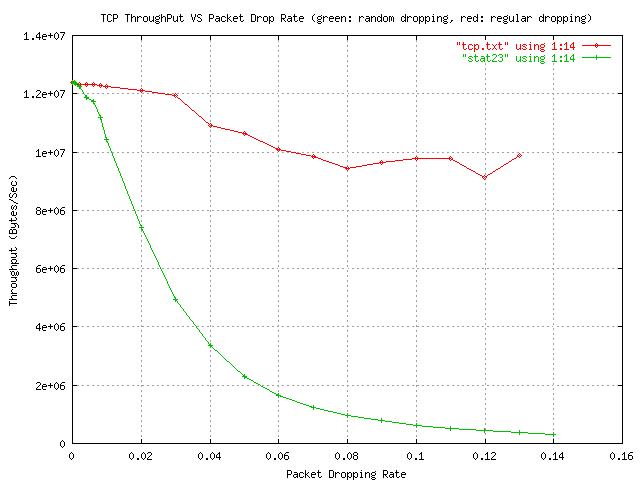
PS version gnuplot script Data file stat23 tcp.txt
The data for the red curve is the experiment data from "regularly dropping packet", See here
The Raw experiment data for green curve
are: drop0 drop0.0001
drop0.0005
drop0.001 drop0.002
drop0.004
drop0.006 drop0.008
drop0.01 drop0.02
drop0.03 drop0.04
drop0.05 drop0.06
drop0.07 drop0.08
drop0.09 drop0.1
drop0.11 drop0.12
drop0.13
drop0.14
The detailed curves between 0 and 0.01 is:
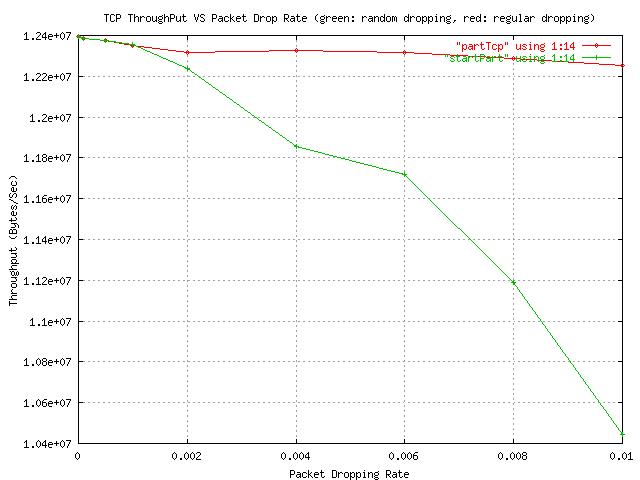
PS version gnuplot script Data file partTcp startPart
The Linux TCP specification here