Chapter 3
Performance Test Result without Packet Dropper
Before we introduce the packet dropper module
to the router, we would like to gather the basic performance (such as system
throughput, packet delay) of our infrastructure.
3.1 Max
Throughput got from the infrastructure
No packet dropper is installed in router (Dublin.cs.unh.edu) so far.
3.1.1 Get throughput by TCP blast test
Table 3.1 shows that the
maximum throughput we can get from my Linux Environment is: 12374712 Bytes/Sec.
It’s very close (about 1% less than) to 100Mb/sec.
|
Blast test when request size is optimal ( 1448
Bytes ) PingTest |
|||||||||||||
|
|
1st |
2nd |
3rd |
4th |
5th |
6th |
7th |
8th |
9th |
10th |
AVG |
Var |
Throughput(Byte/sec) |
|
ElapseTime ( sec ) |
123.21 |
123.19 |
123.26 |
123.35 |
123.22 |
123.64 |
123.32 |
123.33 |
123.47 |
123.17 |
123.316 |
0.106 |
12374712 |
Table 3.1 Performance test data by TCP blast test
The
original data are http://www.cs.unh.edu/cnrg/lin/linuxProject/phase1/blastOptimal.htm
How do we get 12374712 Byte/sec?
Although, we just
send useful data 1448 Byte on each request, we actually send TCP and IP
header and Ethernet Wrapper. We actually send 1526 Bytes for each frame.
(1500Bytes for layer 2 data, 26Bytes for Ethernet packet wrapper, for header
detail, see here
). So actual throughput =
1526*1000000/123.316 = 12374712 Bytes/sec
It is (12500000 - 12374712)/12500000 = 1.0023%
less than the Ideal Theoretical throughput
100Mb/sec
Note:
We know 1 Mb/sec in
Ethernet specification is 1000000 bit/sec, 1KB = 1024 Byte, 1 Byte = 8
bits
Fast
Ethernet 100Mb/Sec = 10^8 bits/sec = 12500000
Bytes/sec
3.1.2 Get throughput by UDP blast test
Table 3.2 shows that by
UDP test, the maximum throughput we can get from my Linux environment is:
12374712 Bytes/Sec. It’s very close (about 1% less than) to 100Mb/sec
|
UDP test when request size optimal( 1472 Byte ) Sending 1000000 udp packets |
||||||||||||||||||
|
|
1st |
2nd |
3rd |
4th |
5th |
6th |
7th |
8th |
9th |
10th |
11th |
12th |
13th |
14th |
15th |
AVG |
Var |
Throughput(
Byte/sec) |
|
ElapseTime ( sec ) |
123.27 |
123.48 |
123.35 |
123.45 |
123.45 |
123.34 |
123.17 |
123.19 |
123.37 |
123.61 |
123.20 |
123.35 |
123.08 |
123.11 |
123.32 |
123.316 |
0.1168 |
12374712 |
|
Packet Loss |
42 |
0 |
0 |
0 |
0 |
108
|
0 |
0 |
0 |
0 |
49 |
0 |
51 |
0 |
61 |
|
|
|
Table 3.2 Performance got by UDP test
The
elapse time original data is: http://www.cs.unh.edu/cnrg/lin/linuxProject/phase1/clientInfoOptimal
The packet loss original
data is:
http://www.cs.unh.edu/cnrg/lin/linuxProject/phase1/serverInfoOptimal
It's pretty
interesting that the Average Elapse Time is the same as that in TCP optimal
case. Incredible!!
So actual throughput = 1526*1000000/123.316 = 12374712 Bytes/sec
It is (12500000 - 12374712)/12500000 = 1.0023%
less than the Ideal Theoretical throughput
100Mb/sec
3.2
Infrastructure Delay
In this section we will find the delay of the infrastructure that we will use to do experiments. This parameter will also be used in NS (network simulator).
We will use ICMP ping packet with different packet size to find out the packet delay in our infrastructure.
Table 3.3 shows the result of ping requests with different ICMP packet request size.
|
ICMP RequestSize |
56byte |
64Byte |
128Byte |
256byte |
384Byte |
512Byte |
640byte |
768Byte |
896Byte |
1024Byte |
1152 Byte |
1280Byte |
1408Byte |
1472Byte |
|
1st |
158 |
173 |
197 |
255 |
291 |
351 |
379 |
420 |
473 |
507 |
570 |
587 |
642 |
659 |
|
2nd |
150 |
182 |
222 |
245 |
282 |
333 |
370 |
410 |
453 |
496 |
541 |
593 |
629 |
660 |
|
3rd |
160 |
173 |
197 |
257 |
288 |
327 |
379 |
421 |
468 |
528 |
558 |
636 |
649 |
651 |
|
4th |
174 |
195 |
224 |
239 |
284 |
337 |
376 |
410 |
464 |
501 |
538 |
597 |
666 |
659 |
|
5th |
160 |
176 |
202 |
244 |
311 |
321 |
376 |
451 |
468 |
518 |
549 |
585 |
645 |
651 |
|
6th |
151 |
189 |
204 |
244 |
286 |
329 |
367 |
413 |
482 |
494 |
538 |
595 |
629 |
676 |
|
7th |
163 |
172 |
193 |
263 |
303 |
321 |
375 |
421 |
463 |
506 |
550 |
583 |
639 |
647 |
|
8th |
159 |
179 |
202 |
250 |
284 |
332 |
371 |
420 |
453 |
500 |
540 |
600 |
632 |
658 |
|
9th |
157 |
177 |
210 |
247 |
295 |
335 |
399 |
447 |
461 |
508 |
562 |
593 |
651 |
650 |
|
10th |
160 |
182 |
215 |
239 |
283 |
332 |
373 |
410 |
453 |
497 |
537 |
591 |
627 |
658 |
|
Average |
159.2 |
179.8 |
206.6 |
248.3 |
290.7 |
331.8 |
376.5 |
422.3 |
463.8 |
505.5 |
548.3 |
596 |
640.9 |
656.9 |
|
Variation |
4.2 |
5.76 |
8.92 |
6.36 |
7.44 |
5.84 |
5.5 |
10.68 |
7.2 |
7.9 |
9.5 |
9 |
9.7 |
5.72 |
Table 3.3 Data from ICMP ping test
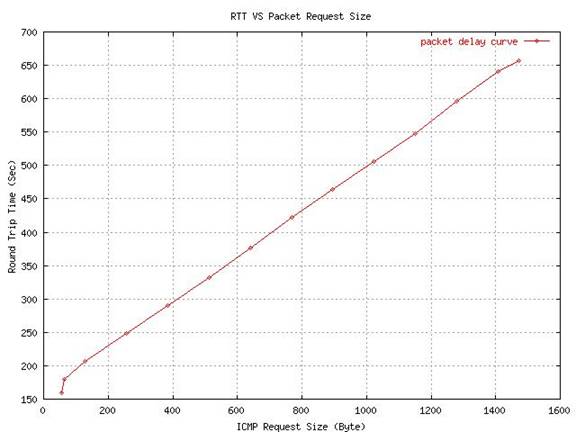 Figure
3.1 shows the relation between RTT and packet request size:
Figure
3.1 shows the relation between RTT and packet request size:
RTT = a * Request_Size + b
Figure 3.1 Relations between ICMP Packet Request Size and RTT
In Figure 3.1, we can use the line
passing point (256,248.3) and point (1408,640.9) to approximate this line
RTT = a * Request_Size + b
so
248.3 = a*256 + b
640.9 = a*1408 + b
Solve the above equations, we can get a = 0.3408 , b = 161.0556
Theoretically,
RTT/2 = delay + 2*(Packet_Size/Rate)
(Packet_Size = Request_size + ICMP header(8) + IP header (20)+Ethernet Wrapper(26) )
RTT = 2*delay + 4*( (Request_Size+8+20+26)/Rate )
RTT = Request_Size * ( 4/Rate ) + ( 2*delay + 216/Rate
)
Where Rate = 100Mb/sec = 12.5MB/sec = 12.5 B/µs
4/Rate = 4/12.5 = 0.32 which is very close to the data calculated from the experiment 0.3408
b = 2*delay + 216/Rate = 161.0566
So delay = (161.0556 - 216/12.5)/2 = 71.8878 (µs) =72 µs